Don’t let the above graph stop you from reading further. The message below is rather simple, but important. In this blog I first chat about how we distribute our economic goodies in the U.S. and across the globe. That’s the equity question or, quite simply, how shares of the pie are distributed amongst our citizens. Then I segue into how many can afford pie in the first place. That is the poverty challenge or how many, in effect, belong to the ranks experiencing economic want.
It recently struck me how little of my blog time has been devoted to seminal social questions like poverty, the soundness of our social safety net, and that fragile infrastructure we call a human services system. After all, that is where I expended most of my professional energies while faking my day job as a pretend academic.
Why so little time on issues that were close to my heart? Perhaps I had been exhausted by the intransigence of these issues given both their complexity and given our increasingly dysfunctional political capacity to confront them rationally. Nevertheless, despite my accumulating cynicism, get ready for a word or two on equality and poverty.
The Equity Question.
I have touched on equality matters in the past, tapping issues like our easy acquiescence to hyper-inequality and like our competing definitions of fairness. Therefore, I will try to keep this section rather short. Good luck with that, I hear some of you uttering.
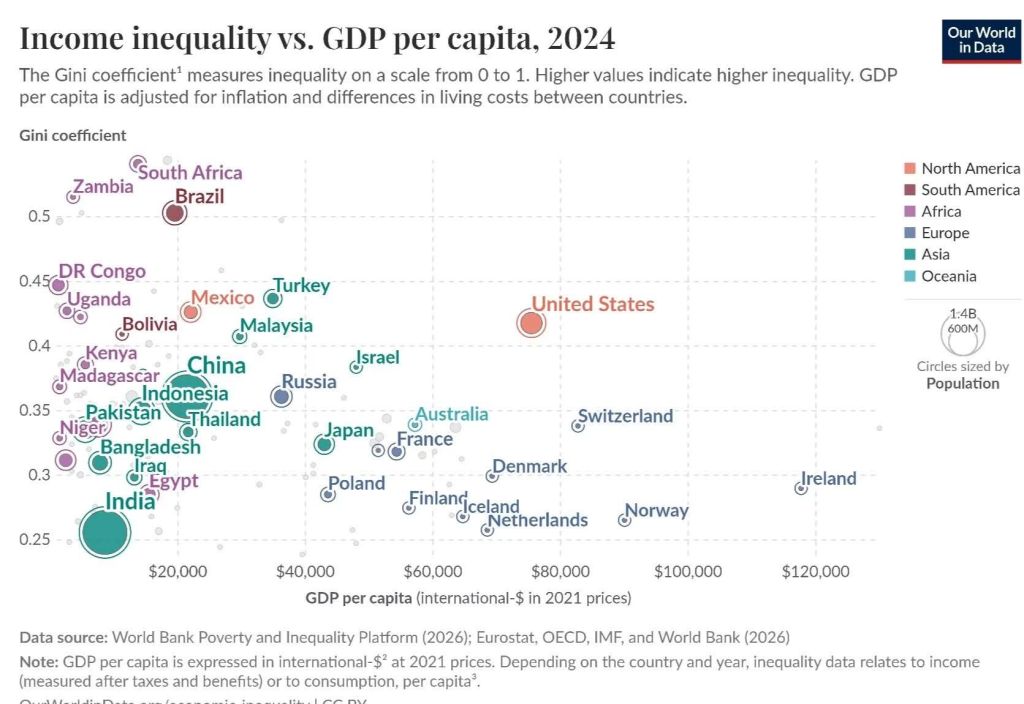
That graph shown at the beginning of this essay tells us something very important about America, an insight I just bet you are dying to know. Well, it tells me (if no one else) that we are both wealthy and, comparatively speaking, selfish. Essentially, we are unwilling to broadly share that wealth in any meaningful manner. The bottom line is this. No matter how you define fairness, most of our peers in other advanced nations do a better job of distributing their pies (national resources) among their residents.
Let’s look a bit closer. Those nations listed to the right on this graph are the wealthier jurisdictions. One’s position along the horizontal axis is defined by GDP per capita. The further to the right your nation lies, the richer the country. Look at Ireland … wow! It has come a long way from being the sick man of Europe, the sad reputation it suffered during my first visit in 1969.
Now, a country’s position on the vertical axis captures how equally, or unequally, a nation’s goodies are shared among its citizens. This equity factor is represented (or captured) by a summary economic statistic termed the gini-coefficient. The lower the score (on a range from 0 to 1) the more equal a society is judged to be in terms of shared economic resources. So, Norway with a score of just over 0.25 evidences significantly more equality than the U.S. which has a score north of 0.4.
Let us focus on the U.S. which, being located in the center of the graph, is not hard to find. What does (or should) that position tell us about the American Dream? Well, on average, we are indeed rich but, at the same time, those riches are disproportionately going to those who already posses a very large share of the national pie. (I dealt with the definition of fairness in an earlier blog and won’t repeat that here.)
My personal value sentiment is derived from our relative position to our peers (other advanced societies). This comparative perspective suggests to me (at least) that being a rich country does not require one to forego progressive public policies. Traditional economic thought once suggested an equity- efficiency tradeoff. Presumably, you had to choose between a robust (efficient) economy or one that stressed equitable outcomes. I no longer believe that to be the case.
Admittedly, my conclusion may differ from those with competing core values. So, let us look at the question from the perspective of John Rawls, the late political philosopher from Harvard. He argued that liberty and justice are best balanced if we make our normative decisions from behind a so-called veil of ignorance, from a position where we don’t know the circumstances in which we might be born. Fairness to someone already residing in a well-to-do household is likely to be far different than someone who might find themselves struggling in a poverty stricken home and a violent neighborhood.
If you don’t know where you will end up, one might avoid a society where a favored few enjoy enormous riches while the many face relative insecurity. Selecting a political system such as America’s would be an extreme bet, highly rewarding for a few but very risky for the many. In that sense, citizens in Iceland, Denmark, Norway, and Ireland have it easier. Wherever they are born along the wealth and opportunity spectrum, they probably will fare reasonably well in life. For Americans, life’s outcomes are far less certain.
While the distribution of personal skills and behavioral attributes play a role in life’s outcomes, so do conscious public policies. Those Scandinavian countries with more equal outcomes (yet enjoying robust economies) generally have erected advanced cradle to grave safety net systems along with protective labor market policies.
Contrary to widespread belief among American Republicans, the citizens of such democratic- socialist nations don’t chaff under intrusive government controls, limited personal liberties, and high taxes. On the contrary, these countries have long enjoyed top positions on international hedonic (happiness) surveys. People apparently like the security provided by robust public services, even if this requires high taxes and less individual freedoms essential to acquiring extraordinary levels of wealth. Apparently, freedom from economic anxiety must possess its own rewards.
The U.S. is an outlier on this graph. That is, it stands out from the others who are included in this analysis. We are clearly rich and we are reluctant to share those riches. Then again, we are a large, diverse nation. Perhaps sharing is easier within more intimate, homogeneous societies.
There are many factors operating here. For one thing, our social safety net is a joke compared to other rich nations. Consider that America is the only advanced nation that does not fully ensure health care as a right of citizenship. In consequence, we have many thousands of bankruptcies annually due to medical emergencies and high out-of-pocket medical costs … a financial disaster not faced by those in other lands. The remainder of our safety net is a bewildering set of confusing, patchwork type programs that are distributed across federal, state, and local levels of government. It is as if we sat down to purposely design our systems of help to fail which, perversely, provides an excuse to further minimize future investments.
On the other hand, the one-tenth of 1 percent at the top of our economic pyramid have raced ahead as the shares of our national wealth are unevenly distributed. I repeatedly have pointed out that the share of income going to the top one- percent has risen from less than 10 percent in the late 1970s to almost one-quarter in recent years. That is a galactic shift. Wealth is now even more unequally distributed. The tip of the pyramid (one-tenth of one percent) now has more wealth than the GDP of China. With the recent IPO for Space-X, Elon Musk has become the first trillionaire in history. We are talking about a seismic transformation that did not occur on its own. The elite had considerable help from politicians and policymakers.
The ascent of neo-liberal (or neo-classical) thought beginning in 1980 has systemically rigged the game in favor of the well-to-do. The Reagan revolution introduced a set of reforms designed to reverse the Keynsian revolution enacted by FDR and spawned by the Great Depression. Roosevelt’s New Deal had led to a post WWII generation where inequality and poverty fell while a robust middle class emerged.
The elite (most of them) never forgave Roosevelt, considering him a traitor to his class. A return to free markets and minimal government had long been the dream of neo- conservatives like Friedrich Hayek and Milton Friedman along with many from the moneyed crowd. However, for this counter-revolution to succeed, the populace first had to forget the hardships generated by the failed pre- depression experiment in hyper- capitalism. The public then had to gradually undervalue the many contributions that public policy interventions made during the halcyon years of the post WWII era of economic prosperity. The population saved from want by assertive public policies had to pass from the scene.
I won’t go though the myriad of changes that have resulted in one of the greatest redistributions of wealth in history over the past 45 years. The RAND corporation now estimates that perhaps close to $80 trillion has been shifted from those who work for a living to those at the very top of the economic pyramid (those remunerated in shares and deferred interest, not a paycheck).
That estimate may pale when emerging AGI technologies really begin to reduce what the elite privately call the tax on corporate profits associated with labor costs. Unlike in the post WWII era, today’s entrepreneurs embrace the shareholder perspective as opposed to a stakeholder view. The former argues that corporations should only be concerned with shareholder well-being. All other concerns such as those of labor, the community, or the environment are completely irrelevant.
Check out another graph at this point (See below). We have all read about our $39 trillion dollar national debt. A big number no doubt. But that alone might not be the big worry. Yes, our debt now exceeds our annual GDP. But that has happened before, to pay for WWII for example. Besides, we are not alone in this kind of borrowing frenzy. All nations now turn to financing expenditures with borrowing while some, like Japan for example, has a public debt amounting to twice their GDP.
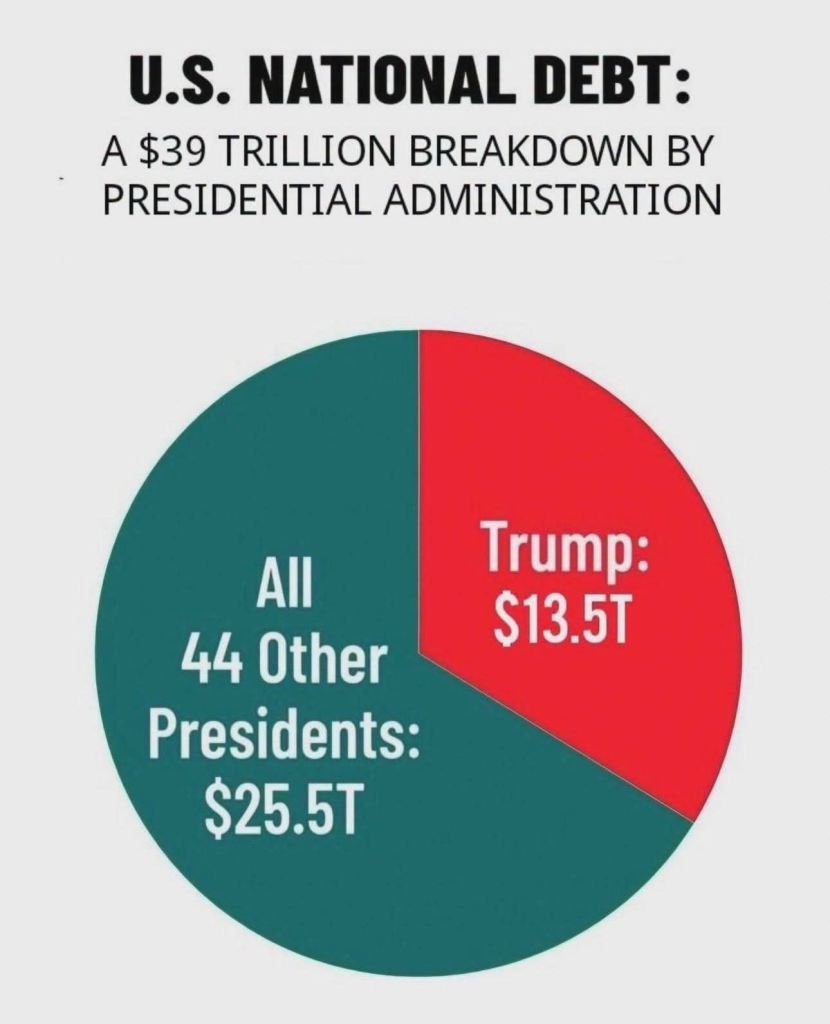
Here is what really bothers me. Donald Trump, in 5 years, has added some $13.5 trillion to our debt. Were those dollars used to improve our infrastructure, enhance our scientific community and public research, rationalize our health care financing system, lower the cost of higher education for the next generation, or invest in renewable energy. If so, I might be persuaded that such borrowing is justifiable in the long term.
No such luck. This latest borrowing splurge went toward turning our Department of Defense into an aggressive Department of War and to further finance the tax breaks for the wealthy long after any remaining progressivity had been wrung out of our tax system. The 2018 Trump tax breaks for the rich and the recent Big Beautiful Bill gave huge windfalls to the existing elite who surely didn’t need the help.
Will such insanity stop? Not likely. Spending on political campaigns exploded after 2010 Citizens United supreme court decision that flooded our politics with corporate money and contributions from the elite. Political spending by economic titans jumped from about 200 million in 2012 to several billion in recent campaigns. In the last election, 300 of the richest families contributed $10 million each, 100,000 times a typical contribution from ordinary citizens. The oligarchs don’t do this for any noble purpose. They expect a payoff and they likely will continue to get them.
The Poverty Question:
I really didn’t expect to spend that much time on the equity issue. As usual, my fecund mind ran away from me. Still, how about a look at the poverty issue from 35,000 feet … that is, a brief overview.
If equity deals with who gets how much of the pie, the poverty question deals with who has enough resources to buy the pie in the first place.
How is poverty determined? That is, who is poor and who is not? When Lyndon Johnson launched his War On Poverty in the mid 1960s, he realized that a formal definition was needed. You cannot fight a war without a known enemy. That task was given to a mid-level analyst in the Social Security Administration named Mollie Orshansky. She took a study that estimated what it would take to cheaply feed a family of three. Then she found another study that estimated low-income families spend a third of their budget on food. Voila! She took her low-cost food estimate and multiplied it by three.
Okay, they needed an equivalency scale to adjust for distinct family sizes and a way to adjust for inflation over time. But her back of the envelope calculation established the golden line … if you had income over that threshold you were not poor. If your income was under, you were destitute.
Mollie attended meetings in D.C. long after she retired. I personally heard her state that she never thought her crude calculation would remain the official line for so long. She clearly assumed it would be replaced by better measures based on more sophisticated approaches. And many tried, including me and several colleagues. Though virtually all sane observers admitted the official measure was deeply flawed, revising it proved politically infeasible.
We were doing this work in the 1990s, after Republican Newt Gingrich took control of Congress. Washington had become a partisan pit where any remaining evidence of reason and sanity was quickly vanishing. No matter how many concessions were made to the other side, there was no room for negotiation. Deadlock on even technical issues had set in.
As bad as it is, here are examples of the current thresholds: $15,960 for single person; $32,150 for a family of four, and so on. My colleagues and I did help devise a set of alternatives, more defensible thresholds along with better definitions of available income. These alternatives generally adjust the lines upward though those changes are partially offset by expanding the income counted as available to families in question. These refined measures are used by the press and others for descriptive and analytical purposes. But for official purposes, Mollies back-of- the- envelope effort remains in force.
Utilizing her measures, we had a national poverty rate of 10.6 percent in 2024. (Note: The 2025 figures won’t be out until September.) That percentage translates into 35.9 million Americans who fell below the magic line in that year.
Now, there is a problem with what I call naked numbers. Is a 10.6 percent poverty rate high or low? Is it a number to celebrate or to grieve? To assign meaning to any naked number we need context. Toward that end, we have options. Among other possibilities, we can look at performance over time, comparisons to our peer nations, or contrasts against some consensus goal.
I will start with a consensus goal. One example is associated with British Prime Minister Tony Blair. About a quarter century ago, he visited Toynbee Hall in London, an iconic neighborhood rehabilitation site where 19th cebtury reformers battled poverty and want. He publicly declared that child poverty would be eliminated within a generation. Good thing he knew he would be out of office when the time limit expired.
A zero poverty rate seems absurd. Yet, in the United States, some very serious observers (Nobel laureates in economics) once thought that a continually improving economy would lift more boats. That, along with a targeted federal war on want might just eliminate U.S. poverty by 1976, our Bicentennial.
And for a while, progress was made. U. S. poverty fell from rates as high as 50 percent or more during the Depression to 22 percent in 1959 to about half that rate in 1974, where the number of poor bottomed out at 22 million. By then, politics had moved on to other battles while neoliberalism began mounting a concerted attack on assertive government interventions.
Perhaps the overall rate is too crude. Perhaps we can learn something by dissecting the numbers. For example, we could segregate the population into three groups: children, adults, and the aged with the young and the old attracting special sympathy. Here we find that our elderly population has done relatively well. Over a third were poor in 1959, a figure that fell to 10 percent as programs for the elderly (SSI, Medicaid, etc) matured. The rate for adults is about the same … 10 percent.
Our young remain the sore point. Child poverty, while falling somewhat from historical highs, remains stubbornly high at 15 percent. It has fluctuated around that figure ever since the 1970s.
Family structure provides additional insights. The rate for female-headed families with children is about 22 percent, for unattached single folks it is 18 percent, for male-headed families with kids it falls to 11 percent; and for two-parent families with kids, the rate falls to 4.6 percent. Ominously, poverty becomes more likely as families become more fractured.
Race is another attribute of interest. While about 1 in 10 Whites and Asians are officially poor, the rate for Hispanics generally has been in the mid teens, while the rate for Blacks has hovered about 20 percent.
Finally, geographical location is a predictor of economic need. Want is much higher in Southern, conservative states. For example, the overall rate in Louisiana is almost 19 percent. In Mississippi, it approaches 18 percent. And, in West Virginia, it is about 17%. On the other hand, the rates in northern blue states like Minnesota, New Jersey, Vermont, and Maryland all hover around 9%.
This is a huge topic which one might spend a life studying. I know that from personal experience. I also know that answers come hard and, believe me, even the best proposals breed more controversy than consensus.
I was in the midst of the welfare wars at the state and National levels when such were front burner issues. Over time, evidence and reason played a less substantive role in those policy debates, though we tried hard.
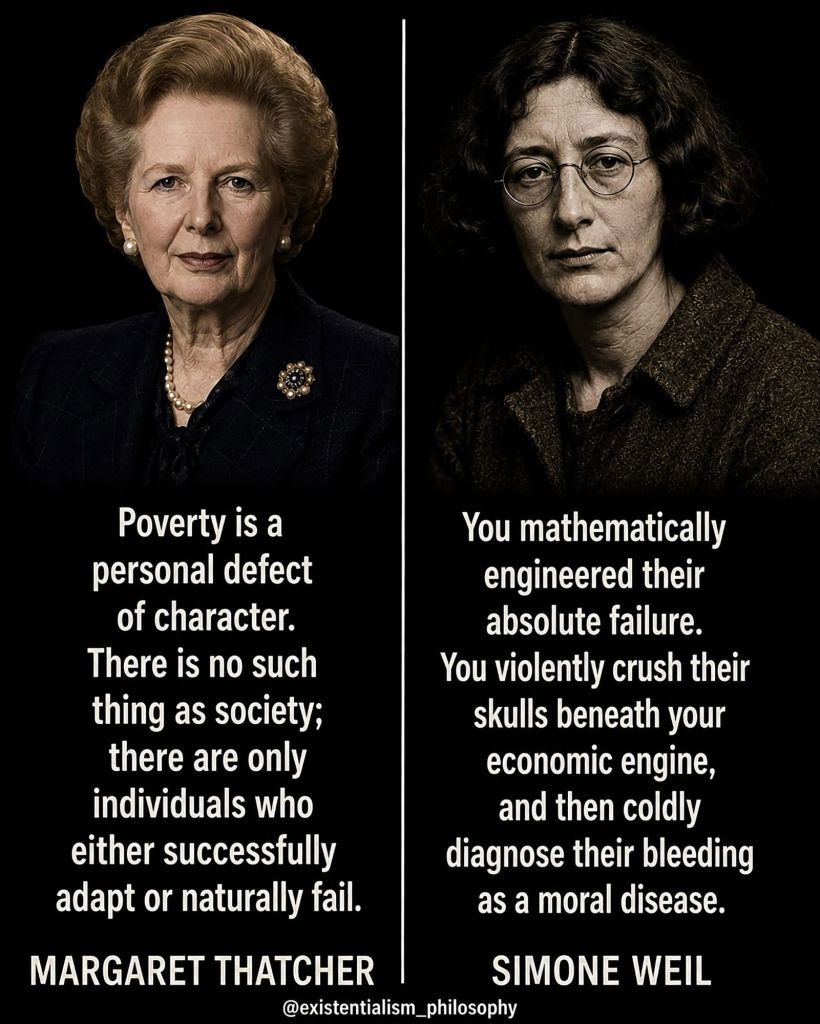
Unfortunately, these issues tap fundamental concerns and prejudices about work, civic responsibility, sexual probity, and sound child-rearing. In addition, the issues become clouded by barely acknowledged racial animosities and latent forms of misogyny. Lurking beneath every argument lies the oft unstated belief that poverty is a personal (read cultural) failing, not a systemic one.
Yet, if we return to our comparative assessment of performance, a positive note emerges. If you look at overall rates (or the rates for key subgroups like children), an intriguing result emerges when comparisons are done across advanced nations. Child poverty rates in Scandinavian are often half, or even one-third, of what is found in the States. Some have come pretty damn close to Tony Blair’s dream of zero child poverty.
This tells me that it can be done. Or, perhaps more realistically, that we can do better. We did make progress when we tried. In fact, we probably made more progress than we realized given the headwinds policymakers faced. The loss of unions, explosions in automation, outsourcing to overseas markets, increased immigration, and now technological threats to our labor markets have made the task more difficult.
Still, difficulty is not an excuse, a reason for giving up. In the end, it just makes the endeavor more intriguing.